

June 1, 2010
With 11 consecutive months of growth, San Diego County is leading the nation’s largest metro areas in home-price appreciation, the widely watched Standard & Poor’s/Case-Shiller Home Price Index showed Tuesday. In March, the index of San Diego prices was up 10.8 percent from the previous year, the biggest increase since the heady days of mid-2005.

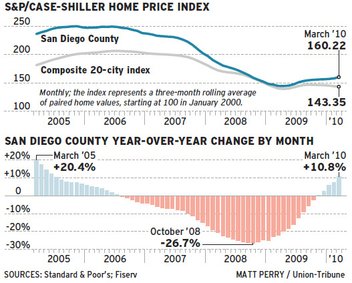
By contrast, prices in the 20 metro areas that comprise the index declined by 0.5 percent from February to March, the sixth straight decline. They were up 2.4 percent year over year.
Robert Shiller, co-creator of the index, said the national trend suggests the worst may be ahead. “I’m worried still about the risk of a double-dip,” he said.
Analysts warned that San Diego’s increase may only reflect a change in market mix, not an increase in value, and that it will likely to slow down and possibly reverse as additional foreclosed homes hit the market.
“We shouldn’t be looking to get to a high, unrealistic, completely overinflated price,” said Brad Kemp, director of regional analysis at Beacon Economics of San Rafael. “We can’t get caught up in the idea that a rising price (out of step with income growth) is good.”
According to Case-Shiller, San Diego’s index, set at 100 in January 2000, stood at 160.22 in March, meaning that the price for the same single-family home tracked over time was 60.2 percent higher than it was at the beginning of the last decade. The index rose to a peak 250.34 in November 2005 and fell to 144.43 in April 2009. In other words, it is 36 percent off the peak and 10.9 percent up from the trough.
San Diego’s index has risen steadily since that trough, the only one of the 20 metro areas surveyed to see such an increase. The month-to-month increase has accelerated recently to the February-March rate of 1.5 percent.
Nugent’s colleague, Jim Diffley, who focuses on California, said he thought the San Diego region and the state were ahead of the country because they experienced the wave of foreclosures first.
“The whole issue is the mix of houses,” he said.
Michael Lea, director of the Corky McMillin Center for Real Estate at San Diego State University, said prices are rising because more higher-priced homes are selling than a year ago.
“That’s a positive for the market overall,” Lea said. “We’ve been talking about a shadow inventory that existed, part of which is people who just held off selling because they thought prices were going to continue to go down. If more of those people come into the market, it’s healthy for the market to establish a nondistressed clearing mechanism.”
A breakdown of the Case-Shiller index by price tiers supported Lea’s theory. The top tier, above $465,686, had the largest month-to-month price increases while the lowest tier, below $311,200, fell slightly by 0.3 percent.
Beacon’s Kemp said bank policy rather than market mix may be at work. He argued that banks are keeping distressed homes off the market and thereby prompting overbidding by bargain hunters. That way, prices come closer to outstanding loan balances and banks lose less.
“We think it’s an artificially unsustainable rise being caused by artificially keeping inventories low,” Kemp said.
Lea, who worked in banking before joining academia, said banks are too bureaucratic to engage in this sort of activity. He said many banks continue to work on loan modification and will likely foreclose on more homes as such alternatives prove unworkable for many distressed borrowers.
Regardless, Kemp, Lea and Nugent predicted price rises will slow down in coming months.